 |
 |
the death of coal?
| July 17th, 2015 at 12:00:43 PM permalink | |
| reno Member since: Oct 24, 2012 Threads: 59 Posts: 1388 | Coal consumption is declining. As recently as 2010, coal accounted for 45 percent of U.S. electricity production. In 2014, coal accounted for 38.7 percent of power production, (compared with 27.4 percent for natural gas.) Those are the annual numbers, but looking at the monthly numbers, something unprecedent in U.S. history happened in April 2015: more electricity was produced from natural gas than coal. Coal's market share in April was 30.2%, trailing natural gas' market share of 31.5%. Those April numbers were probably just a fluke, so don't take them too seriously. Nevertheless, the trend is obvious. U.S. production of coal in the first five months of 2015 was off more than 7 percent from the first five months of 2014. In May, production was down 16.6 percent from May 2014. Between January 2015 & April 2015, no new coal capacity was added in the U.S., while natural gas (302 megawatts), solar (362 megawatts), and wind (1.17 gigawatts) have each added production capacity. Incidentally, new wind installations almost doubled in Jan-Apr 2015 compared to the same period in 2014 (633 megawatts). U.S. exports of coal are down 20% in Q1 2015 compared to Q1 2014. In other words, this is a worldwide phenomenon. For the first time in 14 years, China's coal consumption fell-- down 2.9% in 2014. Coal production in China also declined 2.5% in 2014 compared to 2013. Chinese coal imports in 2014 fell 10.9% to 291.2 million tons. Meanwhile, China added 10.6 gigawatts of solar capacity in 2014, for a cumulative total of 28 gigawatts. China's total electricity generated by solar showed rapid growth in 2014, reaching 25 billion kW/h, an increase of more than 200% over 2013. For around two decades, worldwide coal power plant capacity increased at a stable rate of between 20 to 25 gigawatts every year. (Between 2005 and 2012, this tripled.) At the beginning of 2010 to mid-2012, the ratio of plants halted to plants completed was nearly 2:1. From mid-2012 to mid-2014, this increased to more than 6:1. Below is a graph of worldwide coal-fired generation net capacity additions: 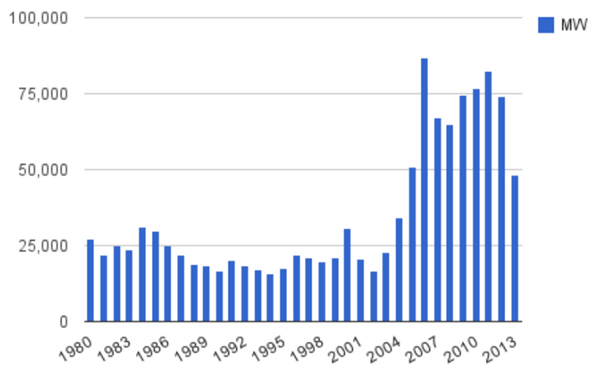 Below is a chart of proposed global coal-fired generating capacity 2014 by region (in megawatts): 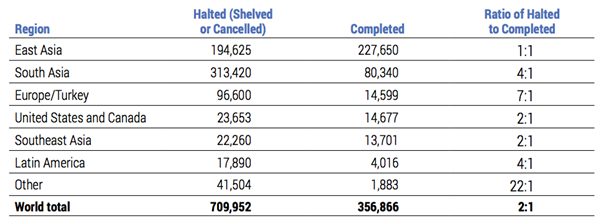 |
| July 17th, 2015 at 12:13:07 PM permalink | |
| AZDuffman Member since: Oct 24, 2012 Threads: 137 Posts: 21232 |
Combination of the Obama war on coal and shale gas being cheaper and more efficient to use. War is peace. Freedom is slavery. Ignorance is strength |
| July 17th, 2015 at 1:03:05 PM permalink | |
| Pacomartin Member since: Oct 24, 2012 Threads: 1068 Posts: 12569 | EIA Electricity Generation U.S. generation of electricity fueled by natural gas exceeded coal-fired generation for the first time on record in April 2015, primarily because of sustained low natural gas prices. Normal seasonal fluctuations in the fuel mix and projected increases in the cost of natural gas for power generation should result in coal-fired generation exceeding natural gas generation for the rest of 2015. EIA forecasts coal's share of U.S. total generation will average 35.6% in 2015, down from 38.7% in 2014. In contrast, the natural gas fuel share averages 30.9% this year, up from 27.4% in 2014. In April 2012, coal fired generation exceed generation from natural gas by only 1.54%, so this news story nearly happened three years ago.
In 1990 Coal was 6X as important as NG, but when President Obama was elected coal was still more than double NG. He basically jumped on the bandwagon. Electricity produced from coal over (under) by percentage electricity produced from natural gas 491% 1990 487% 1991 497% 1992 533% 1993 462% 1994 438% 1995 295% 1996 285% 1997 253% 1998 238% 1999 227% 2000 198% 2001 180% 2002 204% 2003 179% 2004 165% 2005 144% 2006 125% 2007 125% 2008 91% 2009 87% 2010 71% 2011 24% 2012 41% 2013 41% 2014
Electricity produced from coal over (under) by percentage electricity produced from natural gas: 2015 31% January 40% February 10% March -4% April
April is a very low consumption month for electricity as you are between seasons. It is natural that you would only use the newer plants. Note that 2012 was the lowest annual ratio because it was a mild winter. And as always the national trend means very little, because fuel choice is very dependent on the region. In WNC region coal is 11X-12X as popular as natural gas, while it is almost nonexistent in Alaska, Hawaii, and in New England. 1068% West North Central 266% East North Central 106% Mountain 37% East South Central -37% South Atlantic -55% Middle Atlantic -58% West South Central -60% Pacific Noncontiguous -99% New England -100% Pacific Contiguous -4% U.S. Total |
| July 17th, 2015 at 4:49:23 PM permalink | |
| Pacomartin Member since: Oct 24, 2012 Threads: 1068 Posts: 12569 |  Looking on the state level. Energy generated by Coal relative to energy generated by natural gas 73.6 Nebraska 63.7 Wyoming 47.5 West Virginia 33.6 South Carolina 19.7 Iowa 18.8 Kansas 14.6 Missouri 14.0 Kentucky 6.6 Illinois 4.2 Indiana 3.8 Utah 3.5 Michigan 3.4 New Mexico 3.2 Tennessee 2.9 Colorado 2.8 Wisconsin 2.7 Ohio 2.4 Minnesota 2.4 Maryland 1.4 Arizona 1.0 Pennsylvania 1.0 Arkansas 2/3 OF THE ELECTRICITY GENERATED BY COAL WAS IN THE FOLLOWING 14 STATES Texas Indiana Ohio - Democrat 2012 Illinois - Democrat 2012 Kentucky Pennsylvania - Democrat 2012 Missouri Michigan - Democrat 2012 West Virginia Wyoming Florida - Democrat 2012 Georgia Alabama Arizona Note that TEXAS leads the above list, but is not even on the top list. This state has huge energy requirements, and even though it generates more electricity from coal than any other state, it still generated over twice as much by natural gas. 1% OF THE ELECTRICITY GENERATED BY COAL WAS IN THE FOLLOWING 12 STATES Mississippi Nevada Hawaii New York New Jersey Alaska California Massachusetts Maine New Hampshire Washington Connecticut NONE OF THE ELECTRICITY GENERATED BY COAL IN THE FOLLOWING 6 STATES + DC Rhode Island South Dakota Delaware Idaho Oregon Vermont (none generated by natural gas either) District of Columbia (none generated by natural gas either) This kind of issue should not be regulated on national level. It may be nice to eliminate coal fired electric plants, but obviously they are very important to some states. |
| July 18th, 2015 at 8:20:58 AM permalink | |
| Pacomartin Member since: Oct 24, 2012 Threads: 1068 Posts: 12569 | This thread is generating little interest. Mitt Romney thought it might be the issue that would give him Ohio, Pennsylvania, Michigan and Florida and thus the election.
|
| July 18th, 2015 at 8:49:51 AM permalink | |
| reno Member since: Oct 24, 2012 Threads: 59 Posts: 1388 |
Yeah, Obama deserves some credit, but this really isn't about him. This is an international phenomenon, occuring all over the world; it's much bigger than Hussein Obama. Consider that on July 9, 2015, Denmark produced 116% of the electricity they use. The surplus 16% was exported to Germany, Norway, and Sweden. What makes this so noteworthy is that all of that excess electricity came from wind. (Denmark's population is 5.6 million). Moreover, their windmills weren't even operating at full capacity on July 9! Obama's just trying to keep America competitive with the rest of the world, and the rest of the world has decided that the unintended consequences of digging up coal makes it more trouble than it's worth. |
| July 18th, 2015 at 4:38:46 PM permalink | |
| Evenbob Member since: Oct 24, 2012 Threads: 148 Posts: 25979 |
What's amazing is, the number of small hydro electric plants that are still on the grid. This one I see almost every day. It was built 90 years ago and produces 2 MW, which it sells to the local power co. It pays $50K in rent to the TWP, which owns the site. That's a small plant, but it still makes a good profit. The one a few miles down river, in Ada, the home of Amway, produces 30 MW. There are thousands of these around the country, still contributing to the national power base. This is the one near me:  If you take a risk, you may lose. If you never take a risk, you will always lose. |
| July 18th, 2015 at 5:54:08 PM permalink | |
| Pacomartin Member since: Oct 24, 2012 Threads: 1068 Posts: 12569 |
Average Generator Nameplate Capacity in Megawatts for each of 19K generators in the USA 1044.24 Nuclear 272.12 Coal 138.47 Hydroelectric Pumped Storage 85.64 Natural Gas 62.14 Wind 25.68 Wood and Wood-Derived Fuels 24.80 Other Energy Sources 24.77 Other Gases 19.64 Hydroelectric Conventional 19.51 Geothermal 13.83 Petroleum 7.64 Solar Thermal and Photovoltaic 3.15 Other Biomass They say that this method of generating electricity is hopelessly outdated. We need giant plants in the desert with high voltage lines to distribute it across the nation. There are 232 hydroelectric plants in Michigan that average 1.578 Nameplate Capacity (Megawatts). But Total Electric Power Industry in Michigan is from the following fuel. Nuclear is only 3 facilities (4 generators). 36.68% Coal 36.37% Natural Gas 12.92% Nuclear 5.92% Pumped Storage 3.48% Wind 2.13% Petroleum 1.10% Hydroelectric 0.65% Other Biomass 0.76% Wood and Wood Derived Fuels But some small boroughs are very devoted to their tiny plants. One borough near me charges much more than the current commercial rate. But the homeowners of the borough rarely complain, as they like the concept of being independent. $10.13 per month plus 18.48 cts. per KWH for the first 200 KWH. 15.03 cts. per KWH for the next 400 KWH. 13.82 cts. per KWH for all additional KWH. |
| July 18th, 2015 at 6:07:44 PM permalink | |
| Evenbob Member since: Oct 24, 2012 Threads: 148 Posts: 25979 | They are outdated, but the infrastructure is there and they do make money. I like seeing them because when I was a kid the one near my house was only 30 years old and an important part of the small community. And it's still there, producing at a profit. If you take a risk, you may lose. If you never take a risk, you will always lose. |
| July 19th, 2015 at 1:57:40 AM permalink | |
| Pacomartin Member since: Oct 24, 2012 Threads: 1068 Posts: 12569 | china has plans for an elaborate new grid  They want to build a 400 GW grid in the USA for $60 billion that will rely on wind power.  |